The MHRA Inspectorate Blog recently posted a post [i] discussing Corrective and Preventive Actions, the importance of root cause analysis, and what triggers inspectors to believe that a quality system is not in a state of control.
During inspection, we will look for evidence that the investigation and Corrective and Preventive Action (CAPA) system is operating in a state of control.
MHRA
Some symptoms that a CAPA system is not in a state of control include:
- Investigations being raised long after the event occurred or taking an unreasonable time to complete
- Root cause analysis being raised as a CAPA to enable premature deviation closeout
- A large proportion of CAPAs being overdue or being extended
- Human error being listed as a frequent root cause (there is an interesting discussion of this topic).
Although the post is ostensibly about GMP, it also states that the concepts outlined in the post are equally applicable to deviations, customer complaints, and several other Pharmaceutical Quality System (PQS) activities. It’s a useful lens through which to view the management of risks arising from clinical protocol deviations, and their related CAPAs.
The Role of Metrics
In order for a quality organization to understand whether they are in a state of control, manage risk, and drive process improvement, they will need to understand how their quality system is performing. The symptoms identified by MHRA can all be expressed as metrics and monitored to provide both diagnostic and predictive metrics to improve quality, reduce risk, and better prepare for GxP inspections.
In Clinical Operations, the quality system may appear to be operating well, but in fact, may be failing to examine issues across trials. Linda Sullivan of Metrics Champion Consortium recently observed:
“A key reason RCAs [Root Cause Analyses] are frequently not incorporated at the system level is the lack of available data on issues across trials. This makes pinpointing the systemic root cause(s) very difficult and frustrating for organizations that see the same issues and challenges —believed to have been previously addressed—pop up across their portfolio in other trials…. To assist with systemic RCA, we should ensure data and metrics on issues across trials are readily available.”[ii]
Linda Sullivan, Metrics Champion Consortium
Metrics Dashboards and CTMS
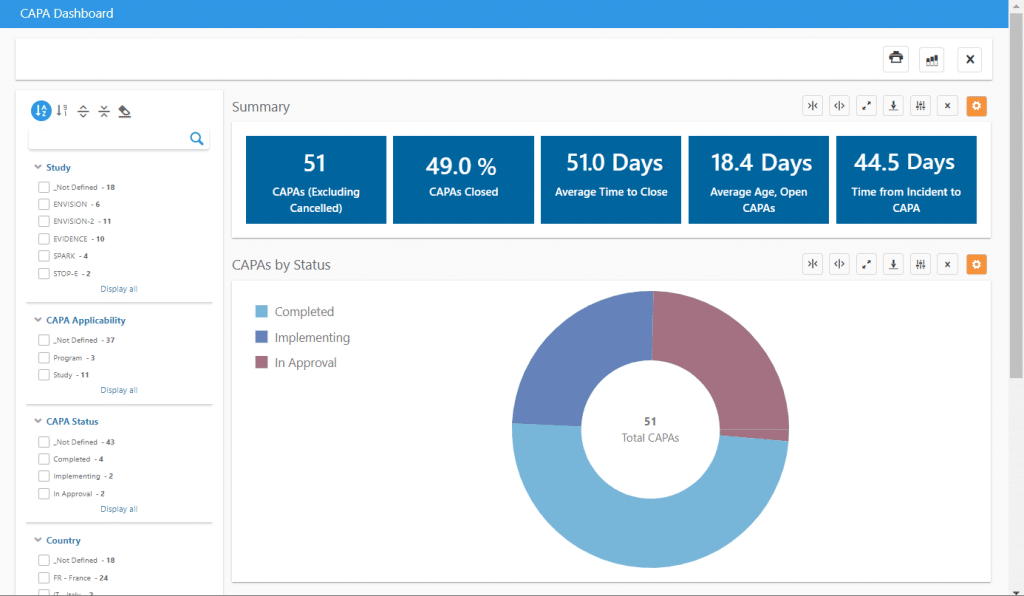
At Ennov, our CTMS is designed to both identify and anticipate quality and efficiency issues. A robust Protocol Deviation and CAPA process is built into CTMS, eliminating the need for integration with an external QMS. Dashboards provide insight into deviations and CAPAs both within a single trial and across trials.
Some key information that can be viewed in our CAPA dashboard includes:
- Average time between deviation occurrence and CAPA
- Average time to close CAPAs
- Average age of open CAPAs
The dashboard can be filtered by study, country, investigational site, CAPA status, and much more to create precision dashboards with the exact information needed. A list of applicable CAPAs can also be exported to Excel with one click for inclusion in reports or use in other analyses.

The related Deviations dashboard allows analysis of protocol deviations, including similar timeliness analysis, deviations by category and importance, and one-click tabulations of important protocol deviations for use in Clinical Study Reports.
If you would like to learn more about how Ennov CTMS can help your trials maintain a state of control, please contact us for more information or a demo.
To learn more about Ennov CTMS, please visit our website or contact us.
[i] “A fresh look at an old topic: Investigations in the GMDP environment”, Callum McLoughlin, MHRA Inspectorate Blog, Posted on:14 September 2020
[ii] “Bridging the Gaps in CAPA Planning in Clinical Trials”, Linda B. Sullivan, Applied Clinical Trials, Volume 29, Issue 5, May 18, 2020


