
Effective Regulatory Information Management involves a constant stream of prioritizations, decision-making, and activity management and monitoring. Effective management occurs when prioritization is risk-based, decisions are deliberate and data-driven, and activity management is holistic.
What do all of these RIM activities have in common? A need for data that is automatically generated, easily understood and analyzed, clearly presented, and actionable.
Historically, RIM analytics and dashboards have focused on retrospective reporting – the information that is reported monthly, quarterly or annually to high level stakeholders. These might involve counts of the numbers and types of submissions completed, registrations granted, commitments fulfilled, and so forth. This type of information, although important, is used by a relatively small number of people in an organization. However, much more is needed to manage risk, plan activities, and drive efficiencies.
We’ve expanded RIM analytics to encompass four key types of analytics that every RIM group should have to support regulatory business.
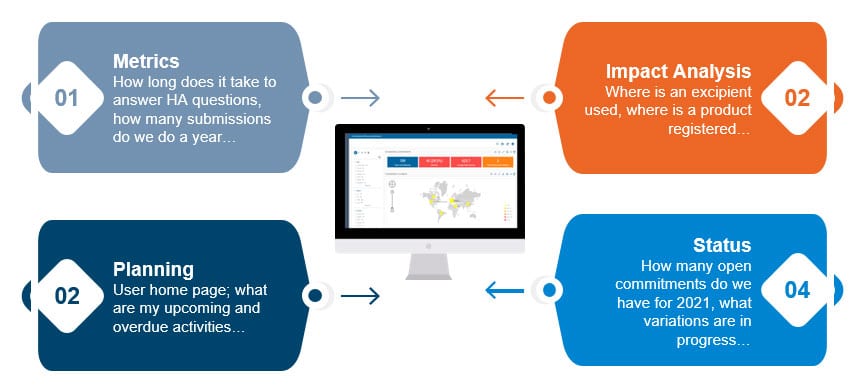
RIM Metrics
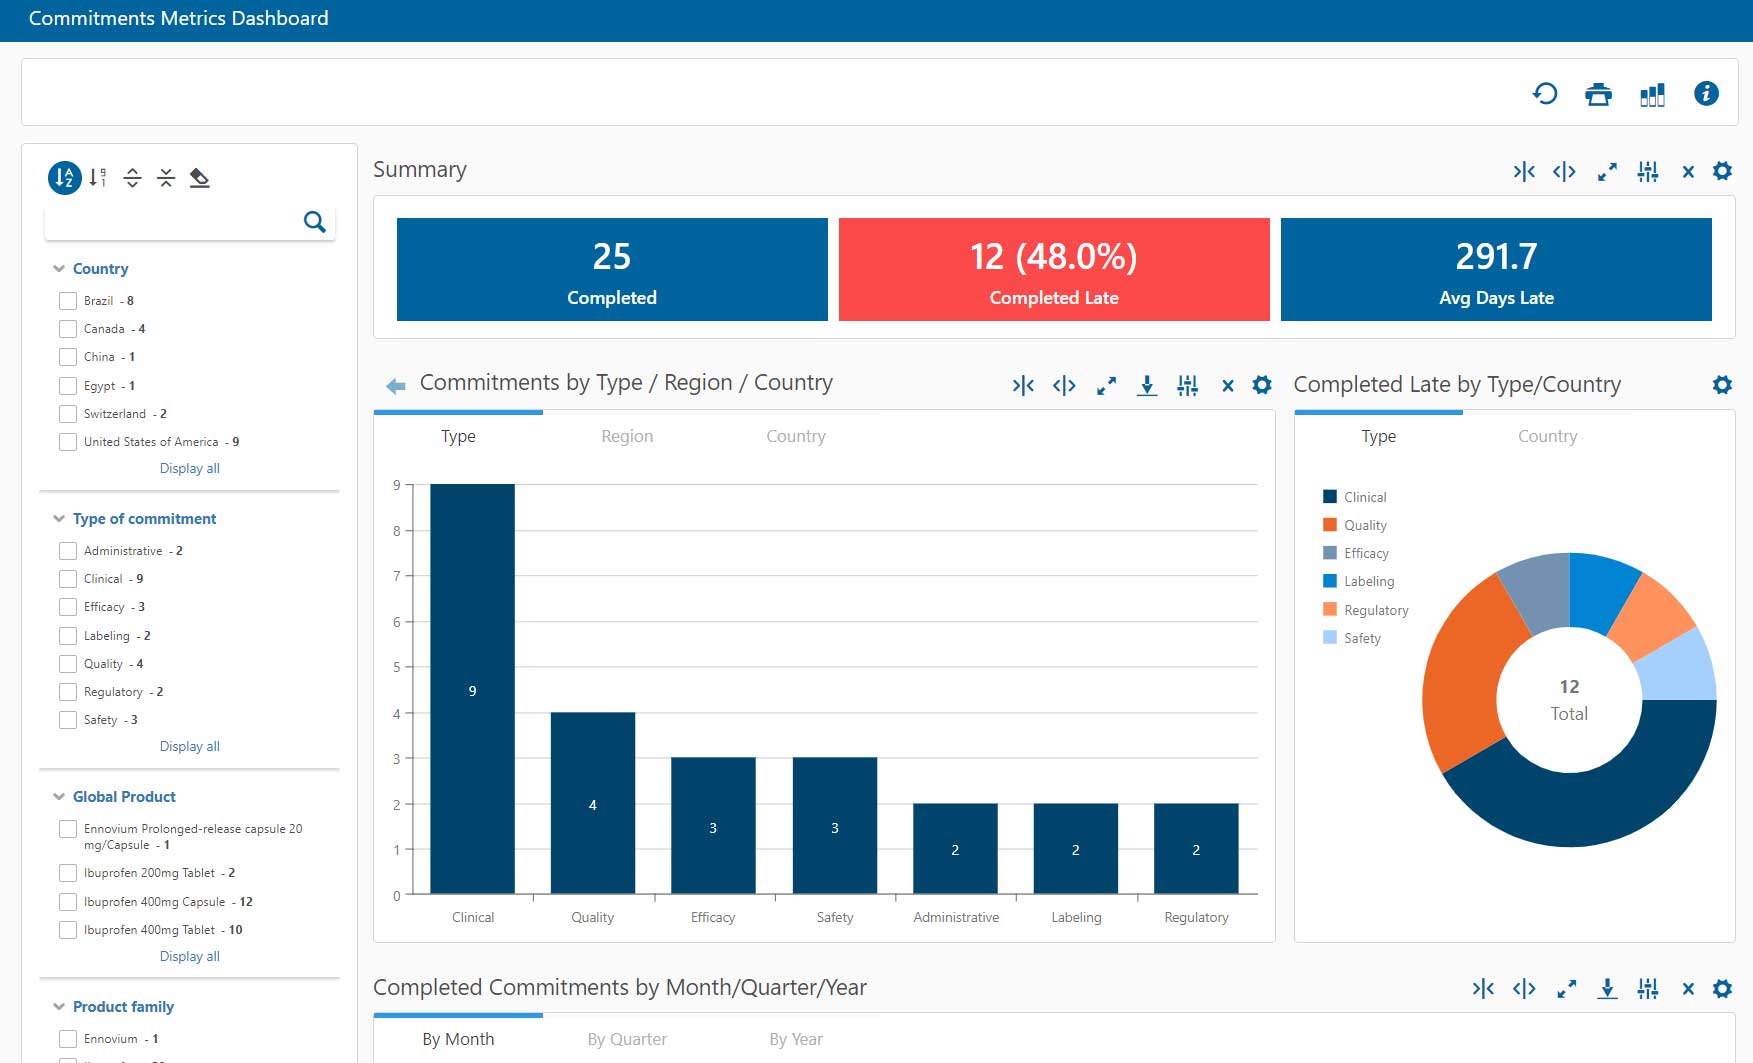
RIM metrics reports and dashboards focus on completed activities and measure volume, effort, timeliness, and effectiveness. They are usually created and reported on a periodic basis, and measure KPIs against defined thresholds Some examples include:
- Number and type of submissions completed; time to prepare submissions
- Quality of submissions measured by such factors as number of follow-up questions or identified deficiencies
- Percent of commitments completed on time vs. target
Percent of study results reported to registries on time (for example, see FDA’s recent actions on failure to file results to ClinicalTrials.gov).
A comprehensive set of metrics dashboards and reports often requires information from systems outside of what is thought of as core RIM – for example, publishing, pharmacovigilance, ERP, or labeling management systems.
The ability to export these metrics for use in emails, presentations and reports is essential.
RIM Planning
RIM Planning dashboards help individuals, teams and affiliates to understand overdue and upcoming activities. These type of dashboards provide information for the “99%” – RIM users managing routine and exceptional regulatory business, usually on a daily basis. For example, they will help users to understand:
- What Health Authority questions must be answered, and how long has elapsed since the questions were raised?
- What information is needed to produce a specific PSUR?
- What ongoing regulatory activities am I responsible for and what is their status?
- What commitments need to be addressed over the upcoming months, and how is progress?
A well-designed user home dashboard will alert a user to upcoming and overdue work of all types, and help the user to understand the volume of work assigned to them. Other dashboards and reports should help a user to understand not just personal work, but work assigned to a team or affiliate.
When users identify priority tasks from a planning dashboard, a single click should allow them to access a selected task and begin or continue work.
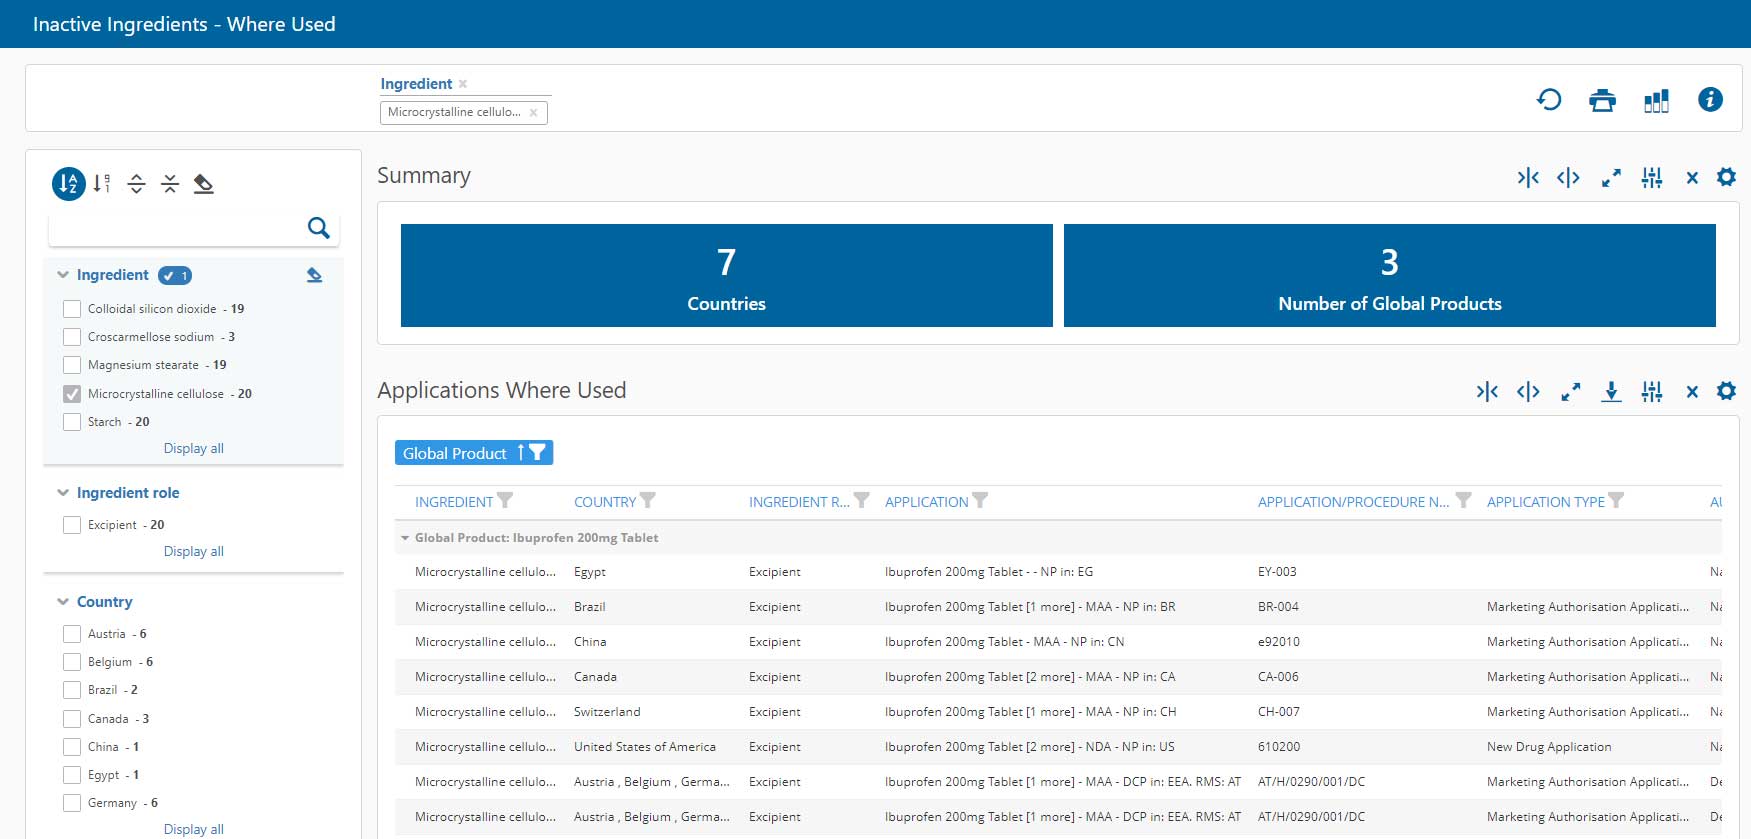
Impact Analysis
Impact Analysis dashboards allow users to answer “what if” type questions:
- What registrations must be changed if a label changes?
- What manufacturers provide a particular API?
- What finished products include a specific excipient?
Impact analysis dashboards should allow these types of questions to be answered in one or two clicks.
Status
Status dashboards provide real-time answers to questions about current status:
- Where is a product registered?
- What variations and supplements are currently in progress?
- What is the status of all open commitments?
They provide a snapshot of where you stand today, and may also be used to support metrics, status and impact analysis.
Conclusion
Understanding risk, managing regulatory activities, and driving efficiency requires comprehensive analytics that are designed with your organization’s goals and business practices in mind. Key features of RIM analytics include:
- Targeted sets of dashboards, each of which answers a set of related questions
- The ability for end users to filter dashboards to present exactly the information they need, without having to do any configuration
- The ability to aggregate data from multiple sources
- The ability to produce figures and tables for external use in emails, presentations and reports
- Measurement of KPIs against thresholds defined by the organization
- The ability to quickly evolve dashboards to add new analytics, adjust existing analytics, and change thresholds as an organization gains experience with the dashboards and refines their processes
Preparing to modernize your regulatory operations? Discover how Ennov’s RIM software brings structure, visibility, and control to local and global regulatory processes.